How to use Ticket Tailor’s reporting and analytics features to maximise your events’ success
From heat maps to sales insights, here’s how Ticket Tailor’s reporting and analytics tools help you make smarter decisions and grow your events.
Share
Each time you run an event a little pot of valuable data is created. This data can be used to improve your future events in ways that genuinely make a difference to your bottom line.
When you crunch the numbers (and don’t worry – there are tools to make this super easy), you can:
See what marketing tactics worked and what didn’t
Understand how people find your events
See which ticket types sell best
And so much more. You can then use this information to hone everything from your marketing strategy to the way your actual events take shape.
In this guide, we’ll walk you through how to make the most of Ticket Tailor’s reporting tools to sell more tickets, and deliver an even better experience for your attendees.
📈 How can looking at data help improve your events business?
Understanding your ticketing and customer data helps you make smarter decisions – resulting in happier attendees and greater success for you as an event creator.
Here are some of the ways looking at data can pay off for your events business:
Channel more effort & budget into what works: Identify your best-performing marketing channels and focus your energy and money where it counts.
Optimise your event page, website & checkout: Make sure everything from your checkout process to the wording on your event page is set up to encourage sales.
Optimise timings: Learn when people are most likely to buy, so you can schedule your announcements, ads, and early bird offers accordingly.
Refine your pricing strategy: Test different ticket tiers, bundles and promotions to see what really resonates with your audience.
Manage crowd flow: Use heat maps to reduce bottlenecks and ensure your venue or outdoor space feels comfortable and well-organised.
Track revenue trends in real time: Know how much money is coming in, from where, and when.
Predict future sales patterns: Use historical data to anticipate when spikes (or dips) in ticket sales are likely to occur.
How to access and use event data in Ticket Tailor
Ticket Tailor’s built-in reporting features make it easy to access your event data. Let’s take a closer look at how to put all this theory into action:
Use time-slot heat maps to gauge peak times
Let’s say you run a Christmas lights show across the festive season and sell date-based tickets. Or, you own a farm and use time-slot ticketing to run u-pick sessions. Whatever the nature of your time-slotted events, knowing which sessions or days draw in the biggest crowds allows you to:
Push popular time slots harder in your marketing
Offer discounts or bundles for quieter slots
Adjust staffing or amenities accordingly
Our Time Slot Heat Maps give you a visually accessible overview of how your event performs across the month, week, or day.
👀 Tip: You’ll find the heat map under your event’s “Reporting” tab. Use the color-coded view to get instant clarity on demand across your time slots.
Understand your audience’s behaviour with Google Analytics
Google Analytics allows you to see how people interact with your website and/or box office page.
By linking your Ticket Tailor event page or your event website to Google Analytics, you can:
See where your visitors are coming from
For example, via Google search, social media channels, or email campaigns. You can use this information to focus on the marketing channels that are bringing in the most traffic. It can also be used to tweak and test the content you’re putting out on underperforming channels.
👀Tip: To get even more precise insights, use UTM tracking on your links (this is where you add small bits of text to the end of your links – called UTM parameters). UTM tracking lets you see exactly which post, ad, email, or campaign drove each visitor, providing a much more detailed understanding of traffic than using Google Analytics alone.
Track drop-off points
It’s always useful to know how visitors to your website or box office are behaving. For example, are you seeing a lot of people hit ‘Buy Tickets’ – only to not actually go through with the purchase? If so, you might need to simplify your checkout, clarify pricing, or reduce friction points (like too many form fields).
A/B test event listing changes
Sometimes the way you describe your event – or the layout and images you use – can affect how likely people are to buy tickets. A/B testing is a great way to try out a few different versions of your event listing to see which one leads to more sales.
You can use Google Analytics to find out which version of a page gets a higher conversion rate.
Elements you might play around with include:
Your event title, imagery, or description
Your ticket pricing structures or early bird messaging
See which channels are converting with Pixel Tracking
If you decide to go down the paid advertising route on social media – say, via, boosted Instagram and Facebook posts – you need to know if your ads are paying off.
Great news – Ticket Tailor supports Pixel Tracking, which lets you track ticket purchases back to your social ads. This means you can:
Measure the return on investment (ROI) you get for each ad campaign
Stop wasting money on underperforming platforms (phew! 💸)
Put more effort and money into the ads that are delivering actual sales
Monitor revenue, sales and more with easy visualisations
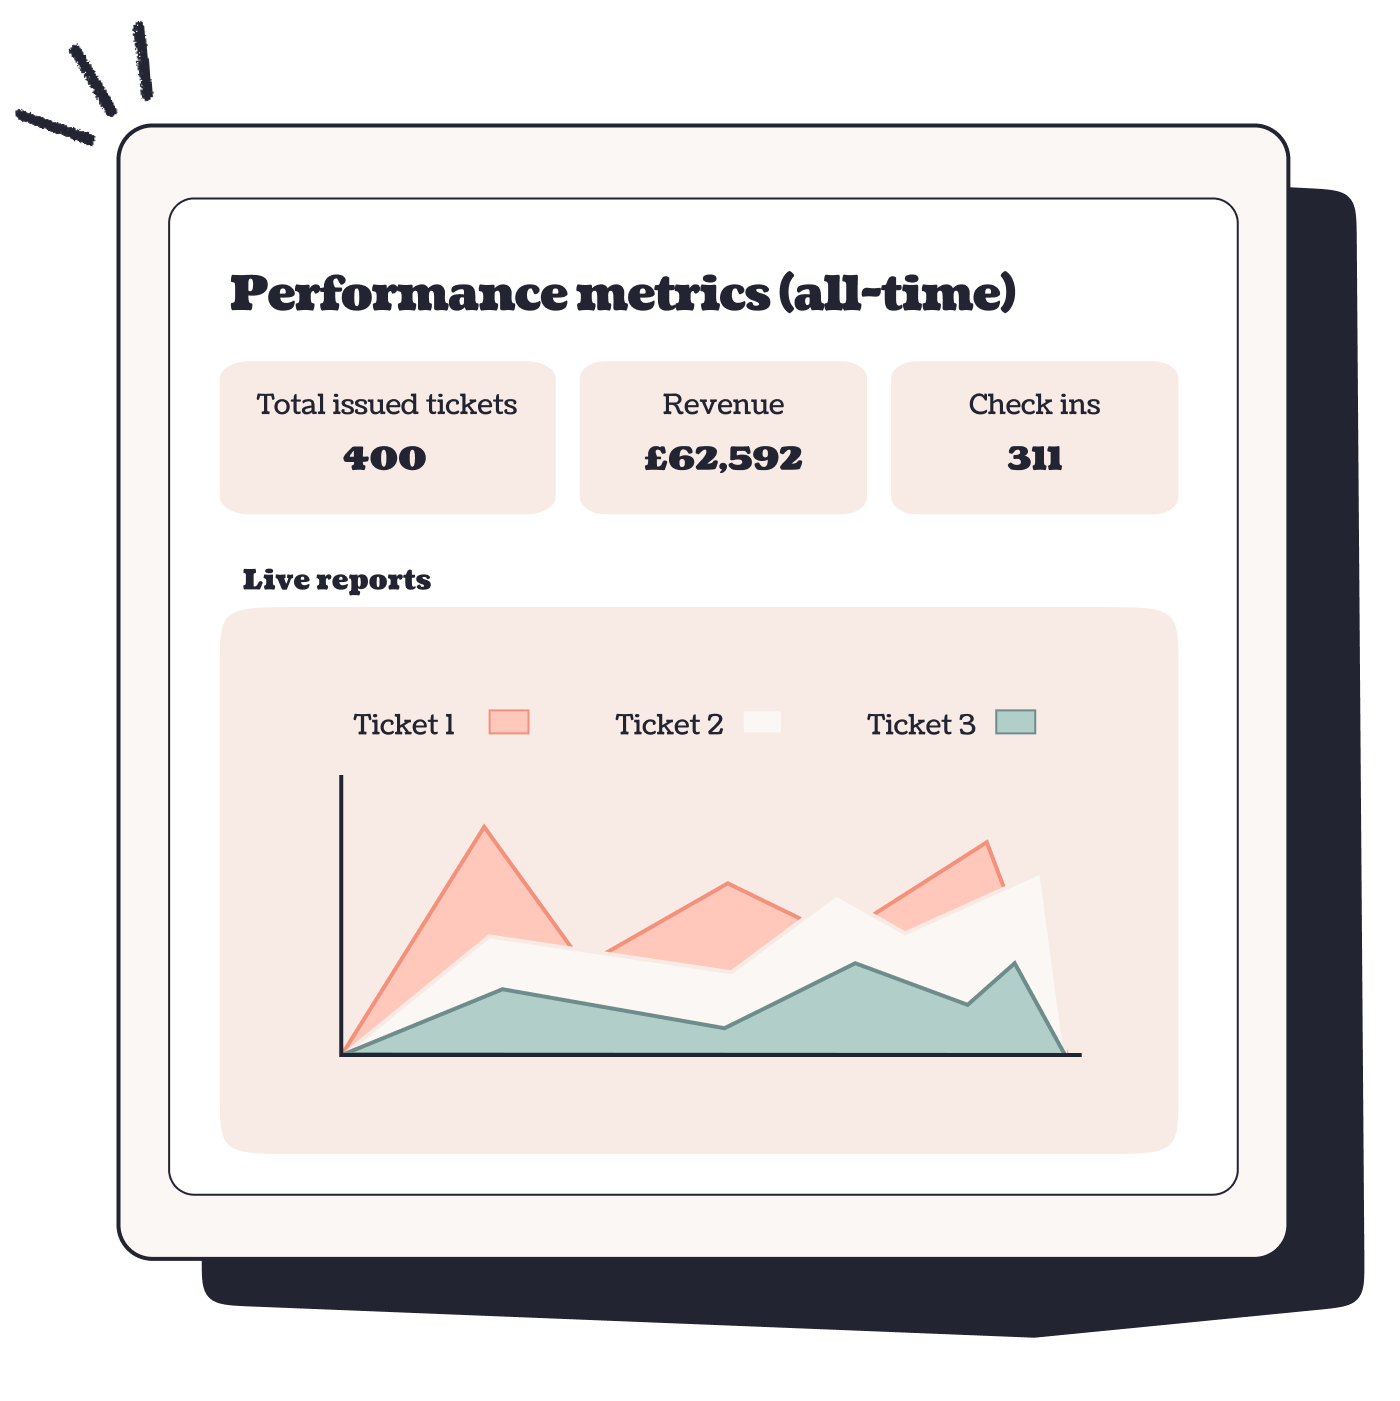
Our built-in dashboards are designed to make it super easy to understand your event data, laying out important info and trends in intuitive visualisations. From revenue over time to ticket type breakdowns, you’ll quickly see:
Which ticket tiers are your top performers
When sales are spiking (and why)
How your revenue is shaping up across event dates or campaigns
Understanding this data empowers you to make smarter, more strategic decisions in your event planning. For example, if you notice a spike in sales after a specific marketing push, you know to repeat this type of marketing (e.g. tactic + timing) in the future. If a certain ticket tier is underperforming, you might adjust pricing or rethink that particular offer.
Use Ticket Tailor reporting to test (and finesse) your pricing strategy
Knowing how to price your tickets can be one of the most anxiety-inducing aspects of event planning. Price them too high – you might put people off. Too low, and you might end up shortchanging yourself.
And what about those early bird tickets? Are they actually helping boost your profits – or just detracting from them?
Ultimately, this isn’t an exact science, which means testing is key.
With Ticket Tailor’s real-time sales reporting, you can actively test different ticket types, price points, and bundles to see what really works. Our multi-ticket type reporting shows you exactly how each ticket tier is performing – both in terms of volume and revenue – so you can make informed decisions rather than relying on guesswork.
You can:
Compare ticket types side by side to see which tiers are selling fastest
Introduce time-limited offers or early bird pricing and instantly track their impact
Spot underperforming options and decide whether to adjust or retire them
Refine your strategy mid-campaign based on live data
This means you can fine-tune your pricing for maximum revenue, without alienating your audience or leaving money on the table.
Track sales from QR codes to optimise your offline marketing
With Ticket Tailor, you can generate QR codes to place on your offline marketing materials – say, flyers or event posters. When someone scans the QR code, they get taken to your box office, reducing friction between spotting your marketing asset and buying tickets.
What’s especially handy about this feature is that you can add a tag to your QR codes that lets you track how many sales they’re bringing in. So, you can literally see how many tickets were bought off a certain batch of posters. Nice!
🚀 Ready to turn your data into decisions?
Ticket Tailor makes it easy to set up reports, track performance, and gain meaningful insights – even if you’re a total data newbie.
Our simple, easy-to-understand visualisations, robust reporting features, and handy analytics tools make it easier than ever to make decisions based on tangible information. All the better for supercharging your event promo and ticketing strategy for more successful, more profitable events.